Capacity to Revenue Model
“The Patients You Don’t Have Could Be Worth 7x More than the Patients You Do Have”
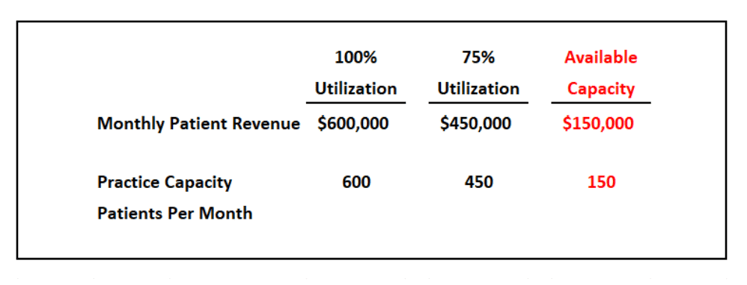
Your healthcare practice has a physical facility and fixed overhead that define your capacity to treat a certain number of patients over a defined period of time – for example 600 patients on average per month.
If your average patient revenue is $1,000.00, then your practice would have total revenue of $600,000.00 per month at 100% capacity. At 75% capacity, your practice would generate revenue of $450,000.00 per month. Most healthcare providers we work with are aware of this concept, as evidenced by their marketing and patient conversion efforts to fill available patient capacity. In this example, that available 25% capacity has a revenue value of $150,000.00.
Your fixed overhead typically stays the same from month-to-month, and won’t vary significantly based on the volume of patients you are treating. Examples of fixed overhead costs include rent, insurance, utilities, salaries, and depreciation/amortization. Your fixed overhead is allocated to the patients you are treating. That number stays the same, no matter whether you are treating 600 patients, or 450 patients. So if your practice has $270,000.00 per month in fixed overhead, for example, here’s what that would look like:

What an impact that 25% difference in capacity utilization has! For 25% less revenue, you get a corresponding 70% lower net operating profit, and each patient’s contribution to net operating profit drops from $250.00 to $100.00.
So here’s the part where challenging conventional wisdom comes in…
As the example illustrates, filling the available 25% capacity would result in a per-patient contribution to net operating profit of $250.00. That might prompt you to believe those patients filling that available 25% are contributing $250.00 to net operating profit, but it just isn’t the case. Take a look at this:
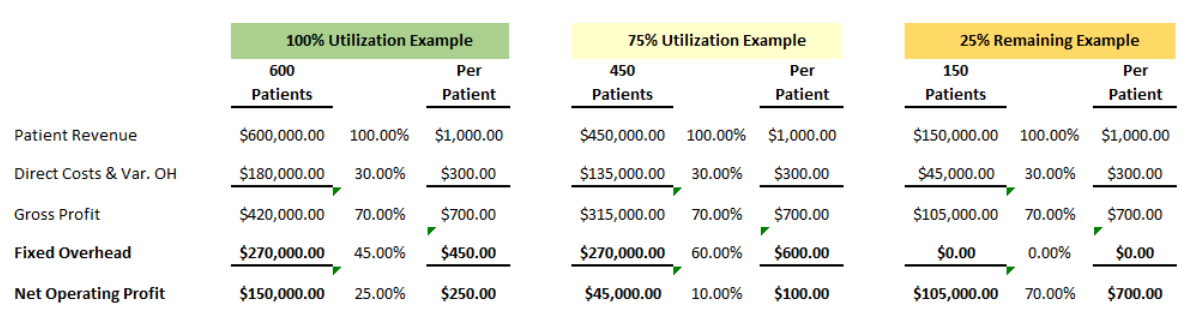
In this example, the new patients filling the remaining capacity are contributing $700.00 each to net operating profit — that’s 7x increase in the per-patient contribution at 75% capacity. Incredible motivation for a healthcare provider to consider methods and options they might not otherwise to fill that 25% un-utilized capacity!
Adding healthcare practice financing, either by partnering with a healthcare financing credit card or a pay-over-time provider, is one commonly used tactic for increasing patient conversions and filling capacity. Using healthcare patient financing, providers allow patients who would otherwise have been turned-away because of an inability to pay in full, or because they don’t qualify for other financing options, to make installment payments on their balances over time.
There are real considerations for a healthcare provider contemplating this option, such as any costs related to health care financing administration hires (not to mention the cost of delinquent account write-offs). But understanding the increased contribution to net operating profit that filling this available capacity can represent, providers can elect to be more aggressive, buffer against occasional costs, and still benefit greatly:

In this example, even if you had to invest 20% of the additional revenue to fill your un-utilized capacity, that remaining 25% utilization would still produce a 5x per patient contribution to net operating profit over the initial 75% utilization. Not to mention you have given additional patients access to your practice’s healthcare services!
It is important to point out that each healthcare vertical will have a different financial formula, so the specifics of the example provided will not necessarily apply to your circumstances. But this principle applies in most instances where a healthcare provider has available capacity — it’s just a matter of degree, based on each provider’s situation.
If you would like to determine your healthcare practice’s formula, we have created a calculator that can give you some great insight by providing just six pieces of information. Schedule a call with us to get a personalized break down. https://hubs.ly/H0jgYz20